Welcome to Starplot


Starplot is a Python library for creating star charts and maps.
-
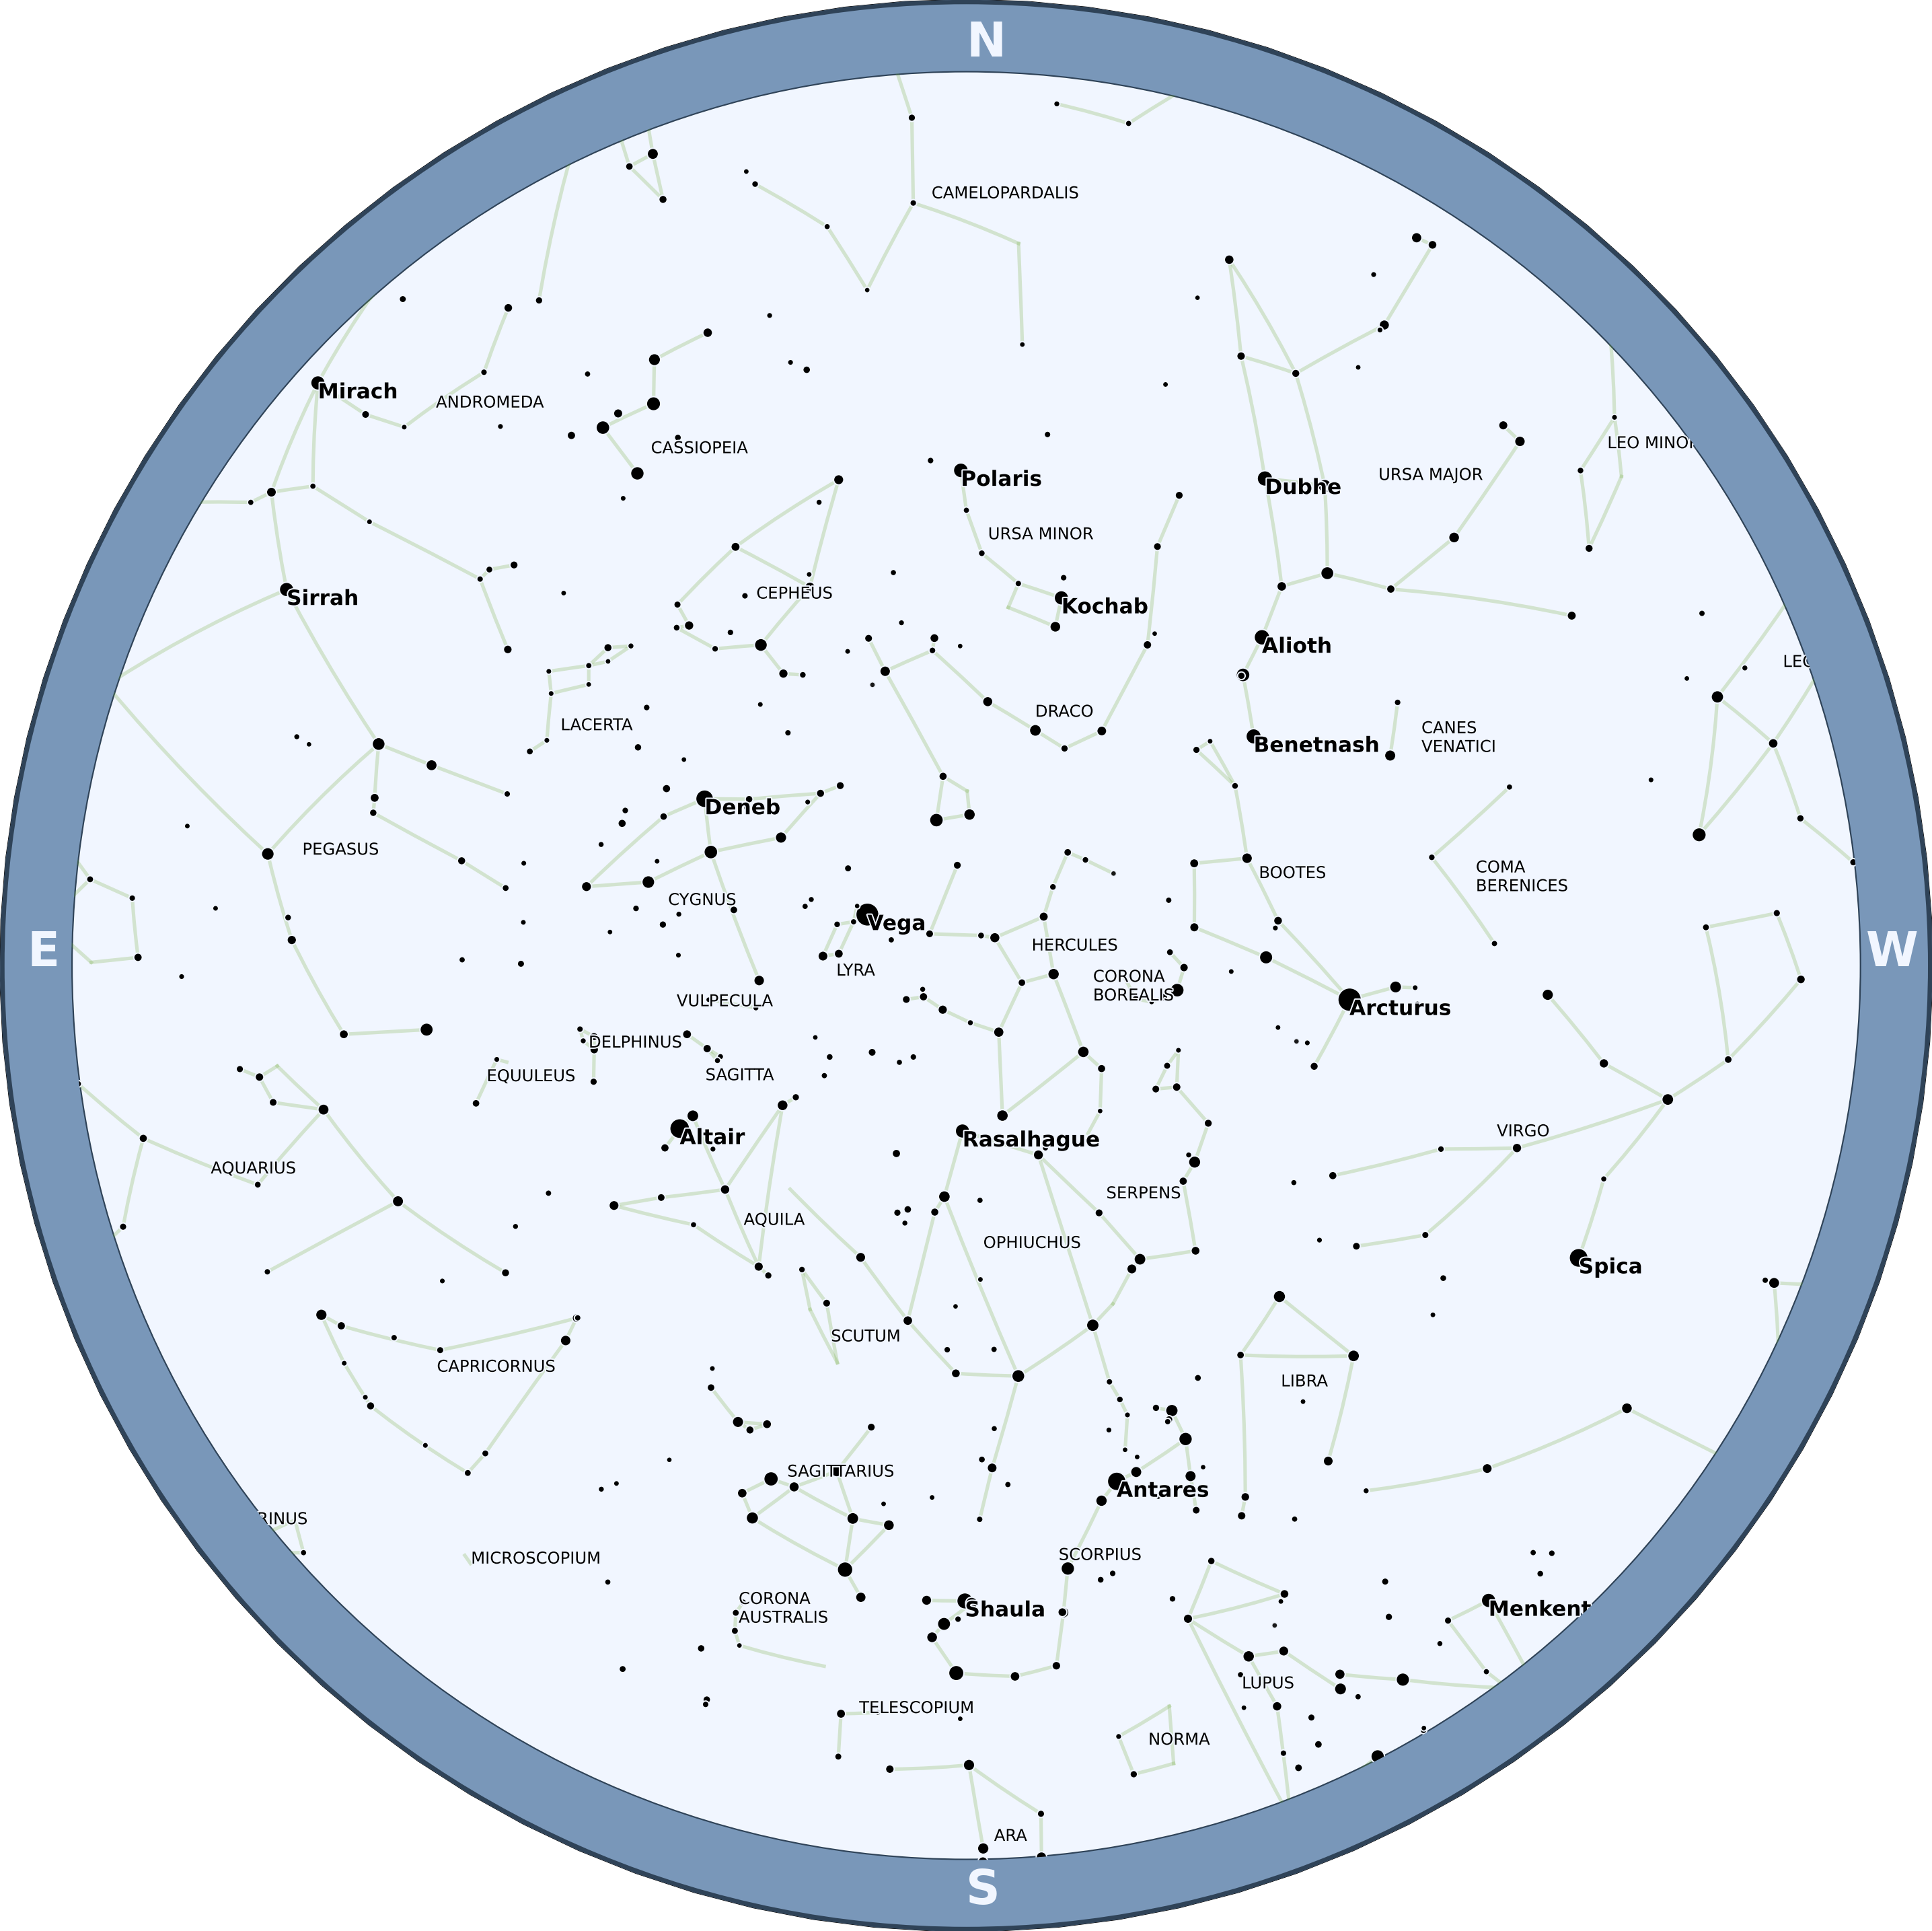
⭐ Zenith Plots - showing the stars from a specific time/location
-
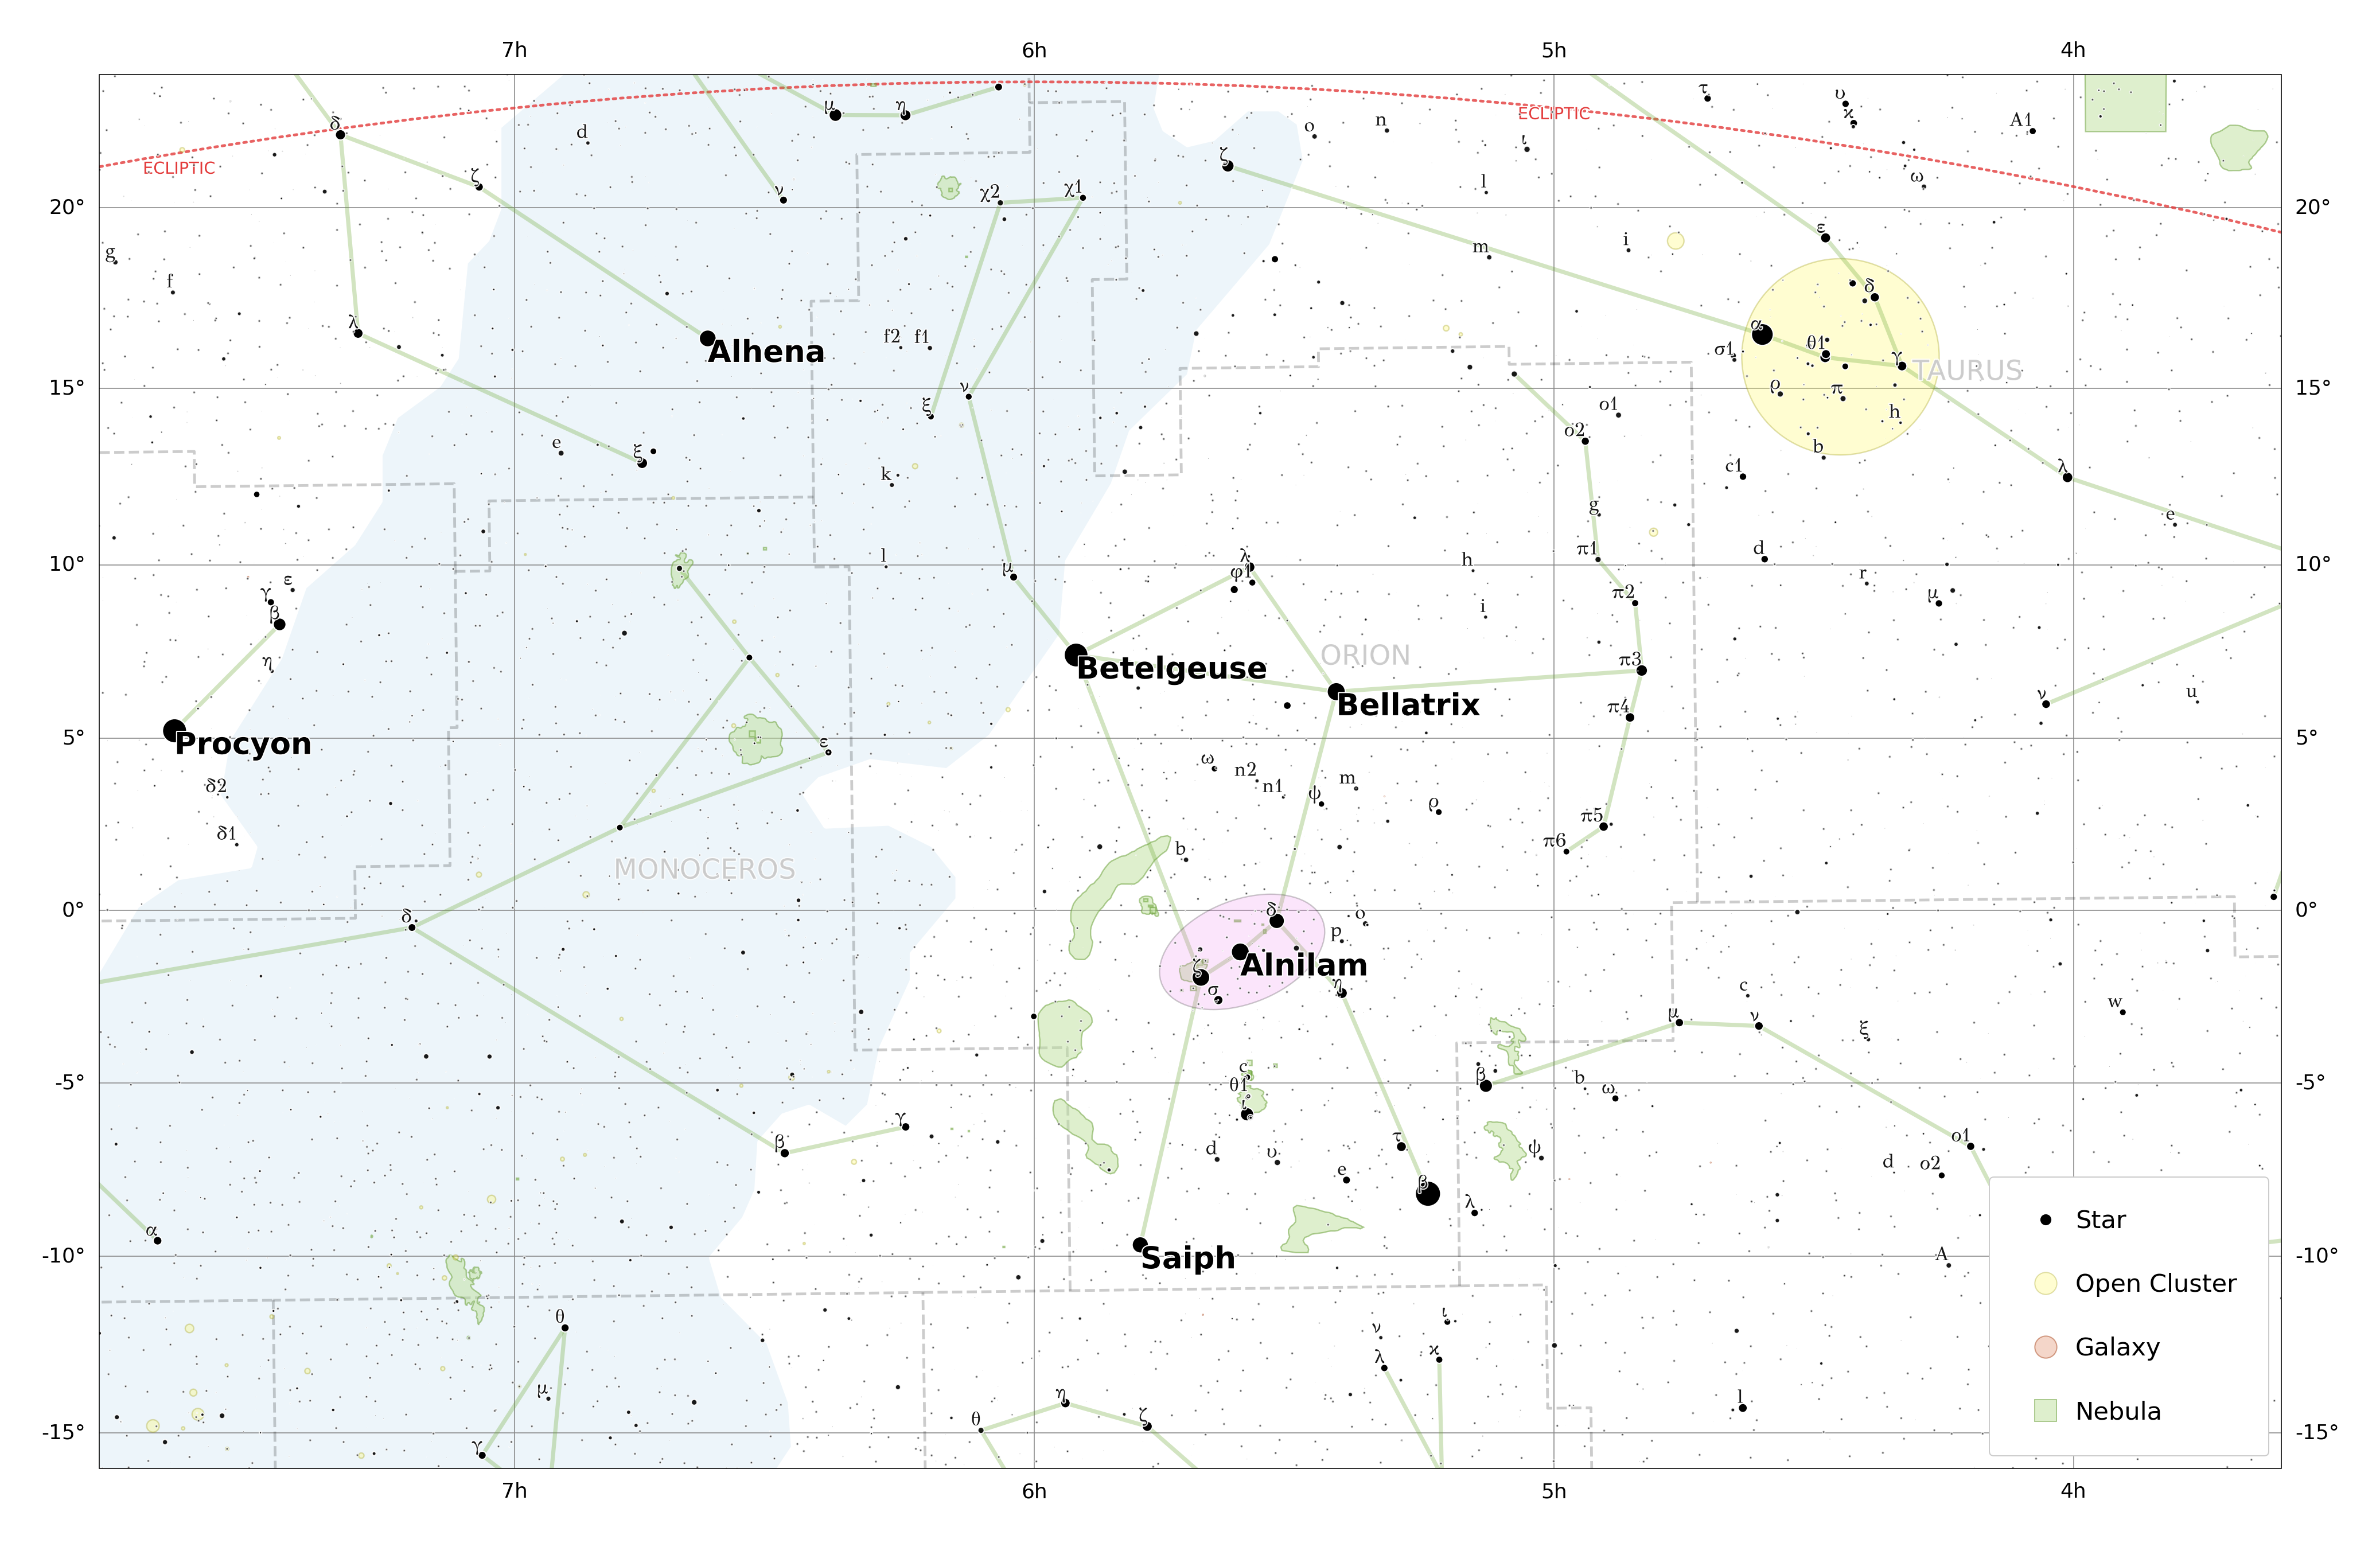
🗺️ Map Plots - including North/South polar and Mercator projections
-
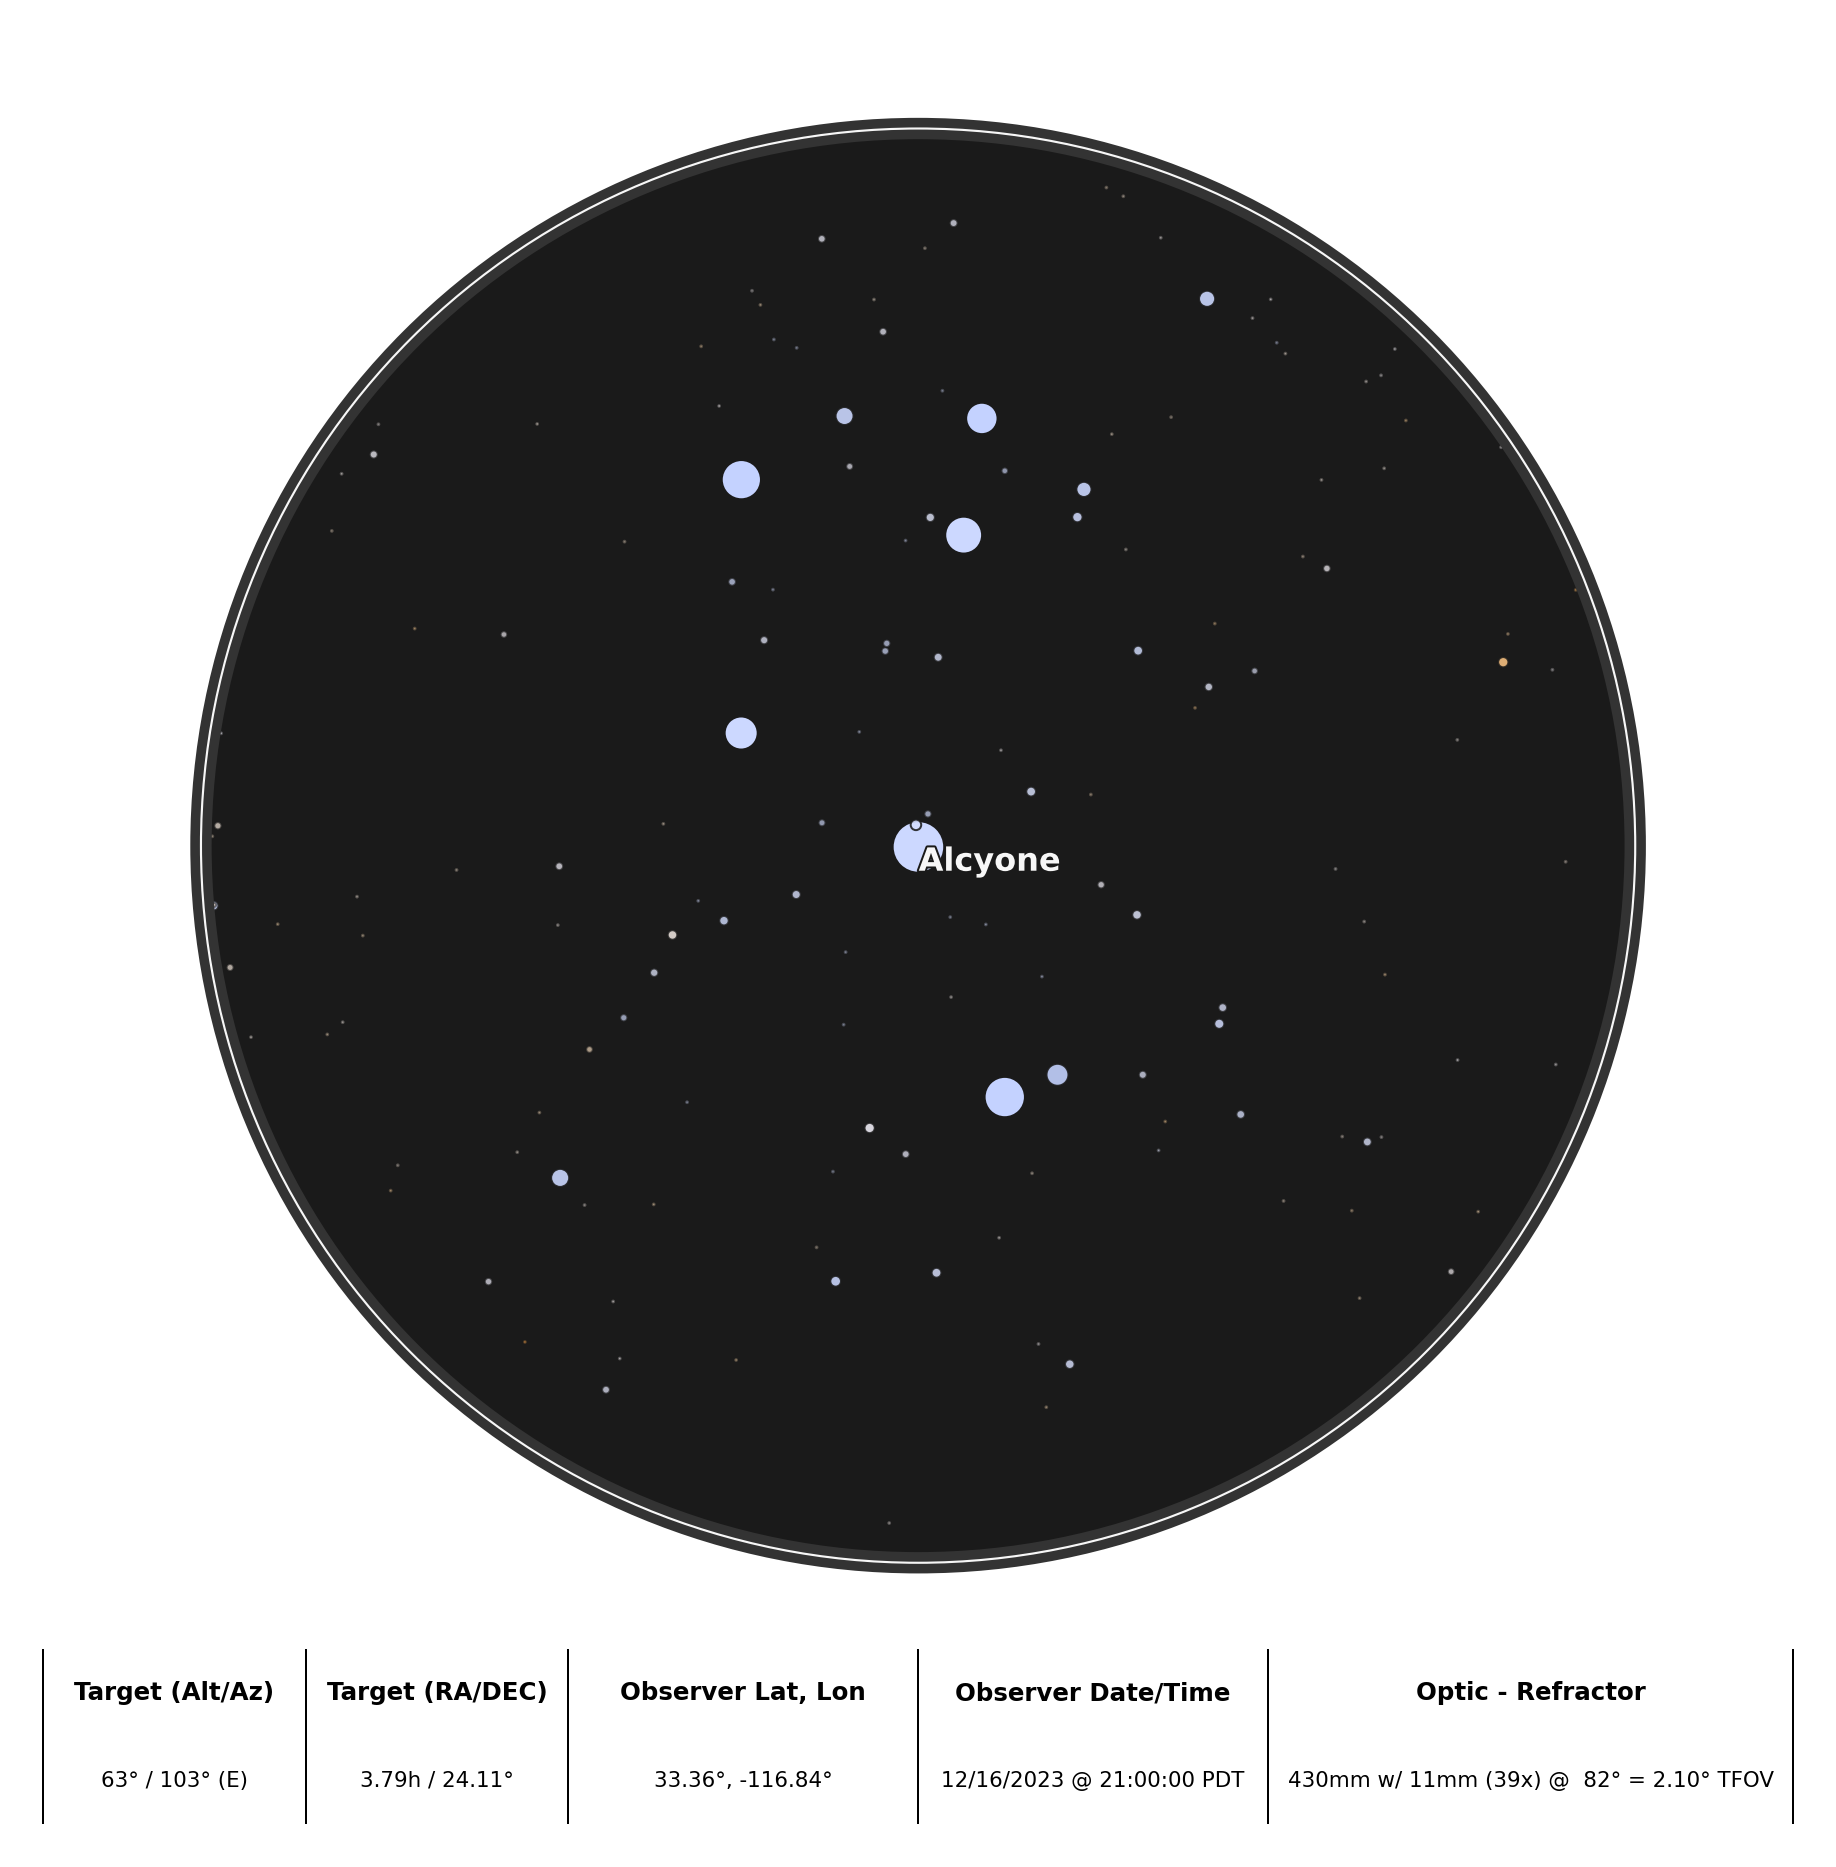
🔭 Optic Plots - simulates what you'll see through an optic (e.g. telescope) from a time/location
-
🪐 Planets and Deep Sky Objects (DSOs)
-
🎨 Custom Styles - for all objects
-
📥 Export - png, svg
-
🧭 Label Collision Avoidance
Join other starplotters on Discord
Upgrading from 0.8.x to 0.9.x
The latest version of Starplot (0.9.x) has some major changes from the previous version (0.8.x). If you've been using Starplot since before 0.9.x, then please check out the examples/reference to see what's changed. The major change is that everything must be explicitly plotted now.
Example charts and maps created with Starplot: